I’m trying to analyze the activity latest data posted by the London lab: https://postera.ai/covid/activity_data.csv
On the https://postera.ai/covid/activity_data page, there is a nice scatter plot comparing the RapidFire pIC50 values against the fluorescence values, but the full list of ‘r_IC50’ values appears to be incomplete.
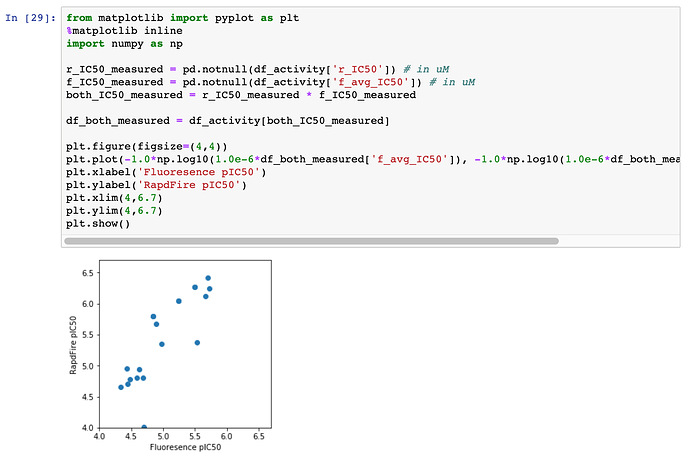
Also I think there is some problem with the values being plotting in the scatter plot. For example: take the compound PAU-UNI-8cdd41c7-1 with the Fluorescence IC50 of 1.89 µM, and RapidFire IC50 of 0.57 µM. This should have Fluorescence pIC50 of -log10(1.89e-6) = 5.72 as is shown in the table. But the scatter plot shows this data point at 4.7 on the x-axis (?)
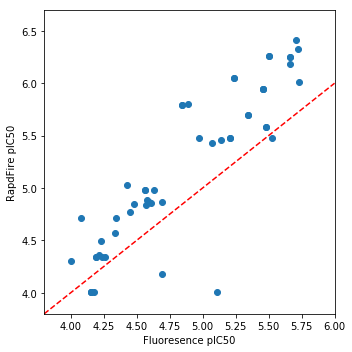
Here’s what I get, at least from the numbers in current activity_data.csv:


