Receptor prep and docking model optimization
This work started with the 6LU7 complex structure, since I thought the conformation of the N3-bound structure would best accommodate growing the fragments from the Diamond screening hits. I began by modeling the 6LU7 non-covalent encounter complex using the deprotonated thiolate form of C145, which forms a good h-bond with the amide NH of the N3 ligand. I ran a 500 ns trajectory of the dimer with ligand bound in one site only, using Desmond MD with SPC waters. From this trajectory, I saved 5000 frames, and generated OEDocking/FRED grids for every frame (as well as for the xtal structure model), and docked the entire dsi_poised library (768 compounds) using the OpenEye FRED program.
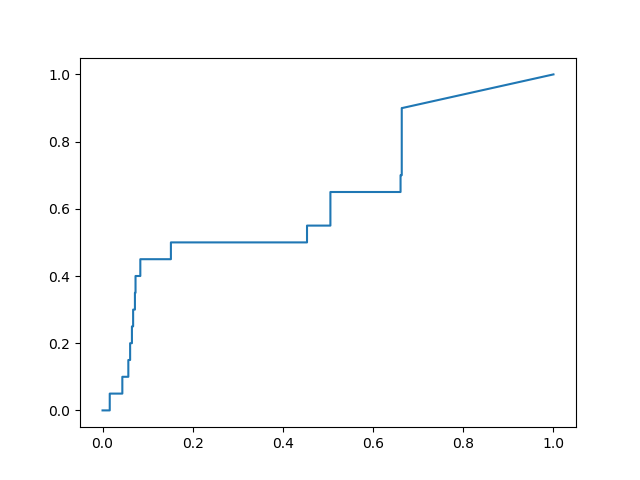
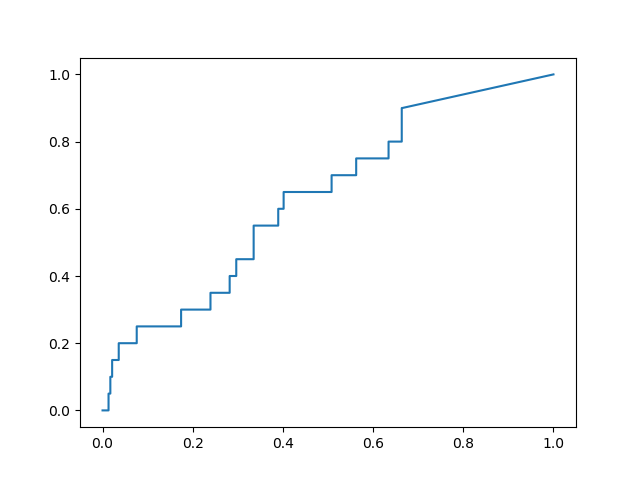
I calculated the ROC curves for recovering the non-covalent actives in the dsi_poised set published on the Diamond website. I computed the early enrichment factor for the top 100 ranked compounds, and found 3 frames that stood out as providing significant improvement over the performance of the x-ray structure model:
Frame #2408:

Ligand Preparation
Ligand protonation states were assigned using the OpenEye filter program with the -pkanorm option. Compounds with more than 8 rotatable bonds were excluded, and the remaining compounds were prepared using the OpenEye Omega program to generate conformations within an energy window of 5.0 kcal/mol.
Docking
The OEDocking FRED program was used to dock the prepared library into each of the 3 frames identified in the validation study described above. Poses were ranked by the Chemgauss4 score, and visually inspected to eliminate any clearly ugly poses. The top 50-80 compounds in each set should correspond to the steep region of the ROC plots, and ideally should perform with a similar enrichment factor of ~5X.
Links to Fragalysis
https://fragalysis.diamond.ac.uk/viewer/compound_set/DemetriMoustakas-OEDocking/FRED
https://fragalysis.diamond.ac.uk/viewer/protein_set/DemetriMoustakas-OEDocking/FRED
1 Like
Hi @dmoustakas, thanks for this. Really interesting, and I’m glad you have done some nice validation. The early part of the ROC curve looks promising!
One question, from me who has very little knowledge of docking, is the “visual inspection to eliminate any clearly ugly poses” equally distributed on all of the compounds or just focused on the the already top scoring ones? Just wondering what the estimated time workflow is for that entire process.
Hi! The docking wrote out the top 500 hits to an output file, and I reviewed the top 100, eliminating about 3 or 4 compounds due to egregious weird poses - I’ll open the intermediate file and post a picture of one of them. They were poses that trapped large voids between the ligand and protein, which happens sometimes in docking, but in my experience is really rare in high-affinity complexes.
I reasoned that the top 100 represented about 2.5% of the input set, so quite likely that was the region to focus inspection on. It took 20-30 mins to QC the set. Also, since it was a very small number of compounds I subjectively filtered, it likely could be omitted in the future.
1 Like

This is the performance of the un-optimized 6LU7 X-ray structure model BTW.
Cheers,
Demetri
Thanks, @dmoustakas. Good to know! That is a pretty good rate of attrition from eyeballing; glad to know this target seems alright for the workflow.
This looks like a nice improvement.
Do you think it might make sense to validate it retrospectively?
I mean, taking the existing scores could you divide into random (or systematic) test and training sets, use the training set to predict the best model/frame, and then analyze the performance on the test set.
Best,
Alex
Hi @AlexanderMetz, that’s typically what I’d do, except that in this case, there are only 22 non-covalent actives that bind in the active site, and 2 of those are really tiny fragments. Splitting the actives into two sets that are structurally representative of each other might be tough. However, we could incorporate compounds as more data is collected, which could certainly be used to compute a true test set performance. Also, since the ROC curves here are based on a binary “binder/non-binder” classification (e.g. was it observed in a crystal or not), the information contained in the set is probably a bit less than if it was a set of Kd values with some range that could be used to compute an R^2 value. Just a thought, but I really like your suggestion to more rigorously validate the model selection.
1 Like
I agree. I am just wondering how to use the already existing data to avoid potentially selecting a seemingly good model for the wrong reason. Maybe one could apply some consensus scoring schemes with the hope that it will be more robust than individual models.
Hi @dmoustakas, @JohnChodera @RGlen and I have been thinking about benchmarking computational methods by retrospectively testing it on SARS-CoV main protease data. Docking methods can be benchmarked against a HTS screen against SARS-CoV (https://pubchem.ncbi.nlm.nih.gov/bioassay/1706), which has 290k inactives and 405 actives. A good reference structure for MPro of SARS-CoV is (http://www.rcsb.org/structure/1UK4). If 290k inactives is too many, we can cut it down by subsampling.
I’ve also curated a few chemical series of non-covalent inhibitors against SARS-CoV which can be used to benchmark relative FEP.
Are you interested to run your docking workflow against the SARS-CoV data? Would love to collaborate!
1 Like
Hi @alphalee, that sounds like a wonderful idea! Let me take a look at preparing that set, and I’ll post the docking performance (against these 3 current models) in a new thread.
What might be interesting is re-optimizing the docking models using this set, since these are likely to be far more drug-like in property space than the fragment set I used to generate the current models. Perhaps sub-sampling to get a good representative set of training compounds would enable rapid re-optimization. Maybe we can set up a quick call to talk through some details?
1 Like
Hi @dmoustakas, I’ve just messaged you. Would be great to chat sometime today.

