Hello COVID Moonshot community,
We hope you all are holding up alright. Among our experimental teams, we ourselves have had the virus slow things down – with multiple researchers being delayed by resurgences in their home countries. One thing about having such a distributed team is that we each get to watch our respective countries learn and – all too often – fail to learn from each other during these trying times. Nevertheless, we march on – and this update is mostly a summary of us re-learning a never ending painful lesson in drug discovery: assays are hard.
Also, before I go any further, I would like to thank @edgriffen, who helped write up much of this detailed report on the assays. Since the last data release, we’ve been quite busy looking into assays and trying to confirm some early results. This stage of hit discovery is often quite convoluted as both assays and compounds need confirmation and so it can take some detective work to confirm what is real and what is a mirage.
We’ll try to give enough detail so that you all can follow along in this convoluted story. We have tried to keep it a true retrospective rather than a retcon, so that the information you have is as accurate as possible.
The story starts off with the initial 3 aminopyridine hit TRY-UNI-714a760b-6, a promising starting point in the 10-25 uM range (depending on the assay), from our first round of synthesis. Not just a biochemical hiit, we also have a structure from Frank von Delft’s group at Diamond in Oxford, you can see the structure on Fragalysis [id number x2646]. The amide makes a couple of key hydrogen bonds, the pyridine contacts His42 at the back of the P1 pocket, and the chloro is buried into P2 similarly to the nitrile analogue [TRY-UNI-714a760b-20, x2572]
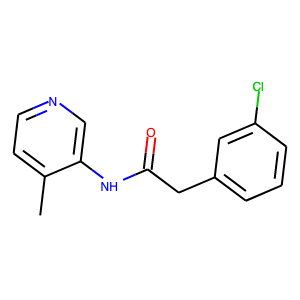
Jag Heer from UCB generously then carried out a pharmacophore search based on the crystal structure of this hit and its key interactions in the P1-P2 subsite. Based on this search and some additional docking Jag performed, we chose some easily purchasable molecules for purchase / synthesis.
One of these compounds was JAG-UCB-a3ef7265-20, an in-stock screening compound from Enamine.
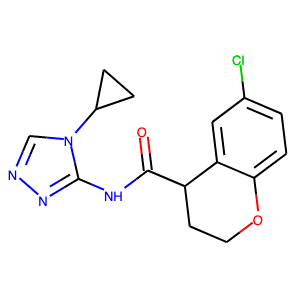
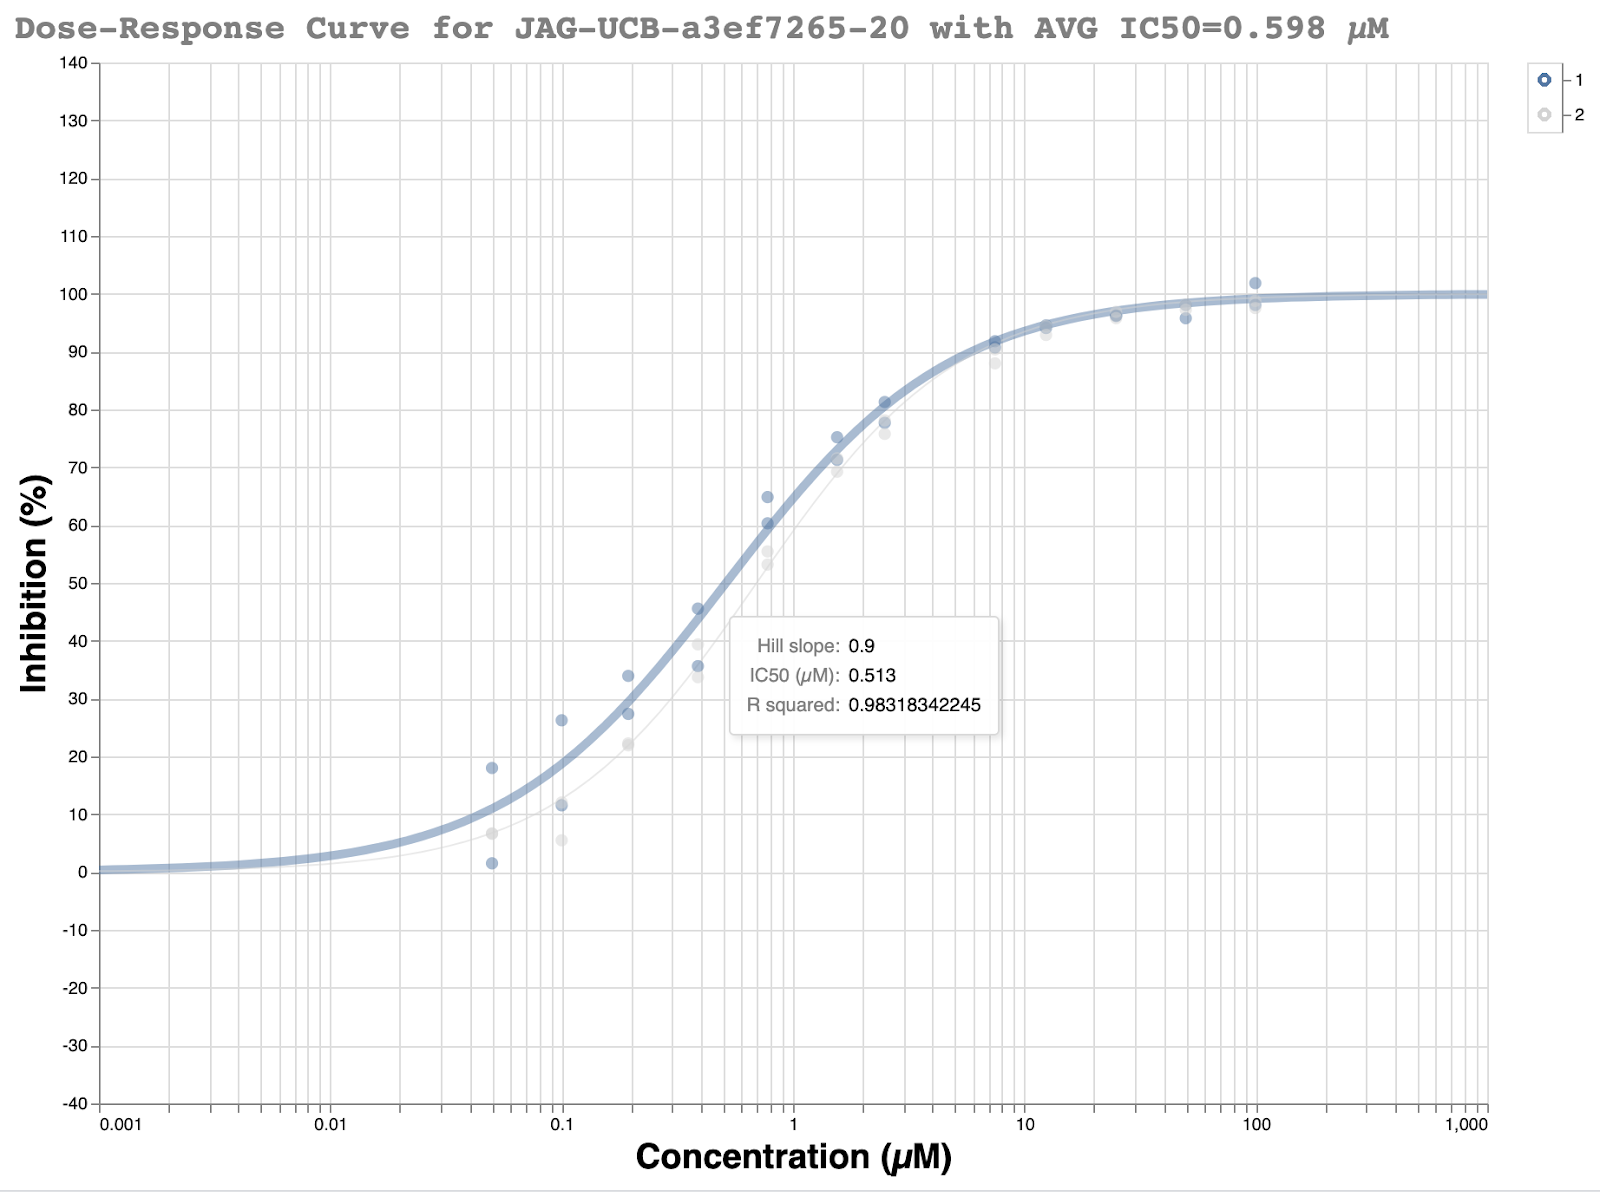
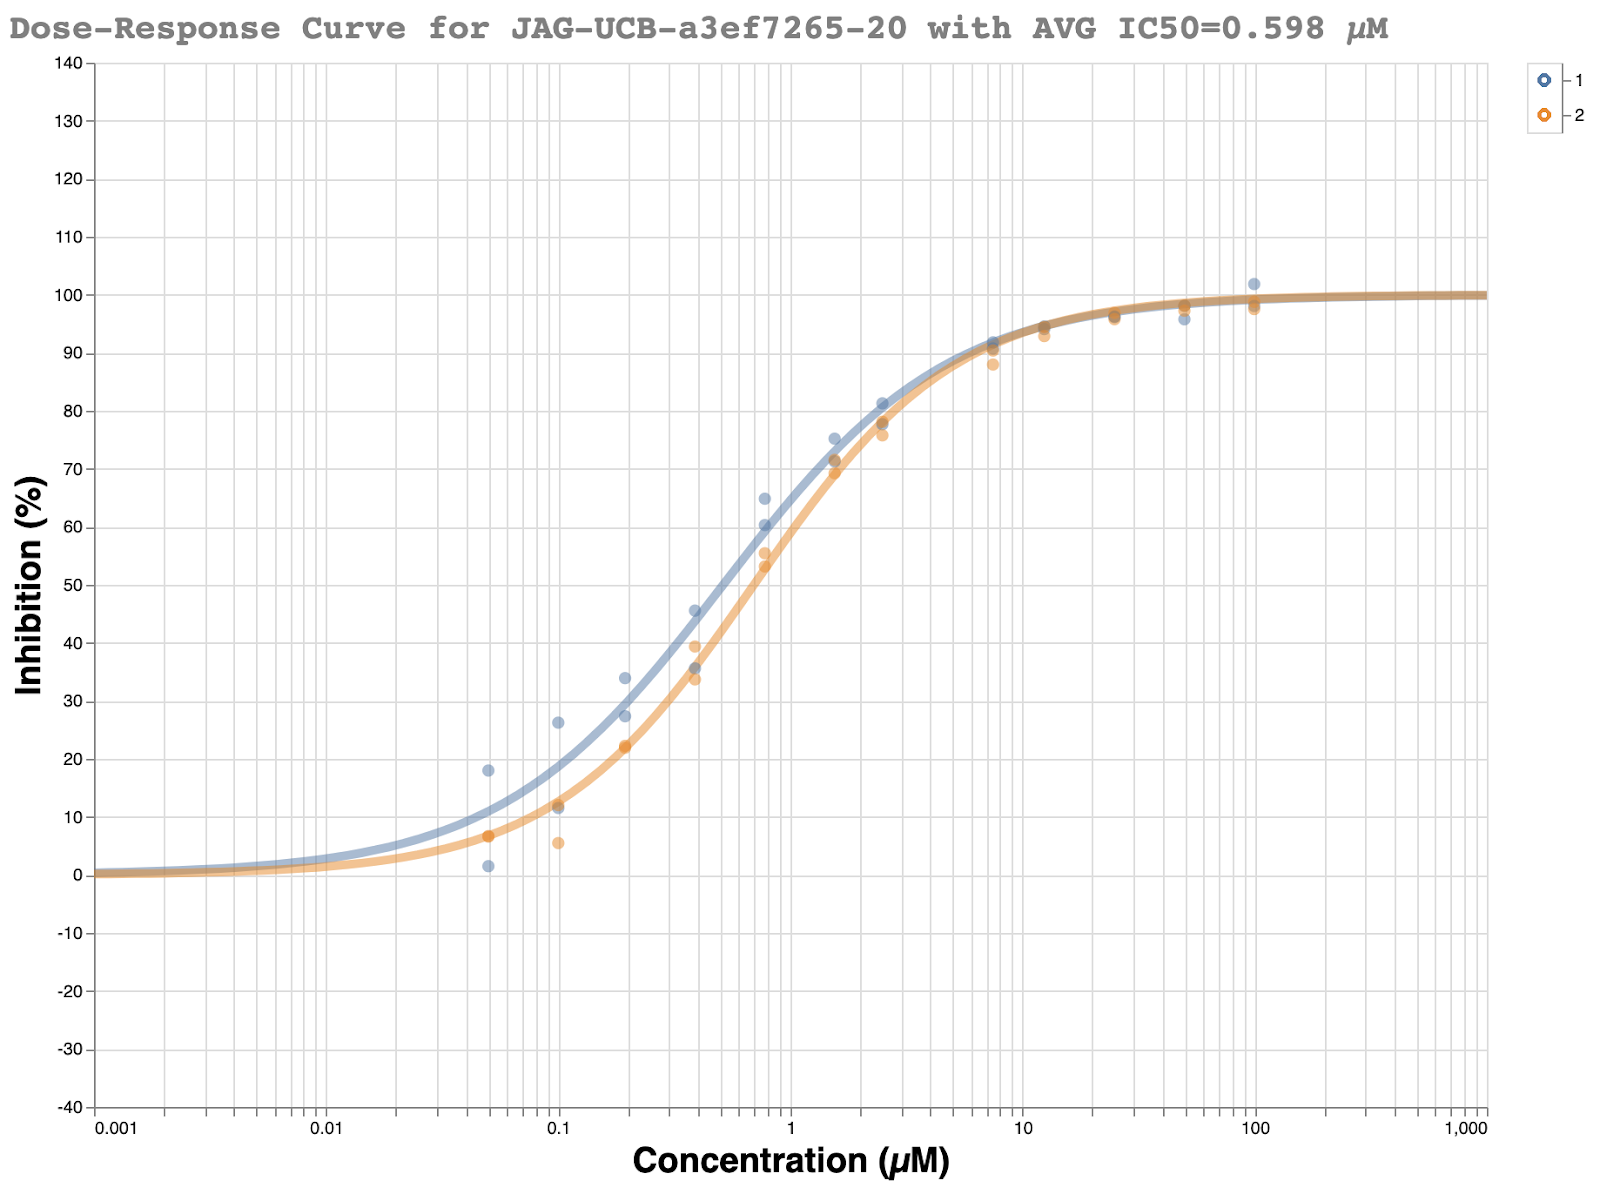
This racemic compound was quickly ordered and tested in the fluorescence assay at the Weizmann. The initial results looked promising with a good looking dose-response curve and IC50 of ~500 nM.
The predicted pose was the ( R ) enantiomer, and we immediately triggered chiral resolution of the existing stock of the compound at Enamine, as well as fresh re-synthesis of the enantiopure compound.
We were a bit skeptical of the initial results because the compound only gave 55% inhibition in the single shot measurement at 50uM in the fluorescence assay to begin with. Our typical requirement to go forward for full dose-response measurement is >50% inhibition at 50 uM. Additionally, the compound had only shown 47% inhibition at 20 uM. Nevertheless, it met the criteria and another dose-response curve was measured at the Weizmann and showed the data was highly reproducible.
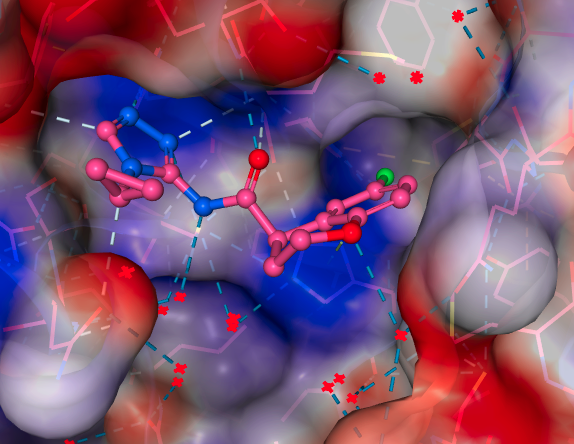
Meanwhile, the Rapidfire MS assay (which detects the cleavage products of the enzymic reaction and therefore is fluorescence independent) at Oxford was lagging a bit behind, so replication in that assay would take a couple of weeks. However, Daren Fearon and Frank von Delft’s team at Oxford quickly obtained a structure which turned out to be of the expected ( R ) enantiomer, with very good looking density [x10324 on Fragalysis]. The pose was also very similar to the docking results Jag had obtained early on in the process.
Just as the beautiful looking structure came in, null results from the Oxford assay soon followed. A full dose-response was carried out just in case the single-shot assay was again showing strange results. However, no inhibition was seen. If you enjoy seeing what a flat line looks like, the dose-response curve from the RapidFire assay is below:
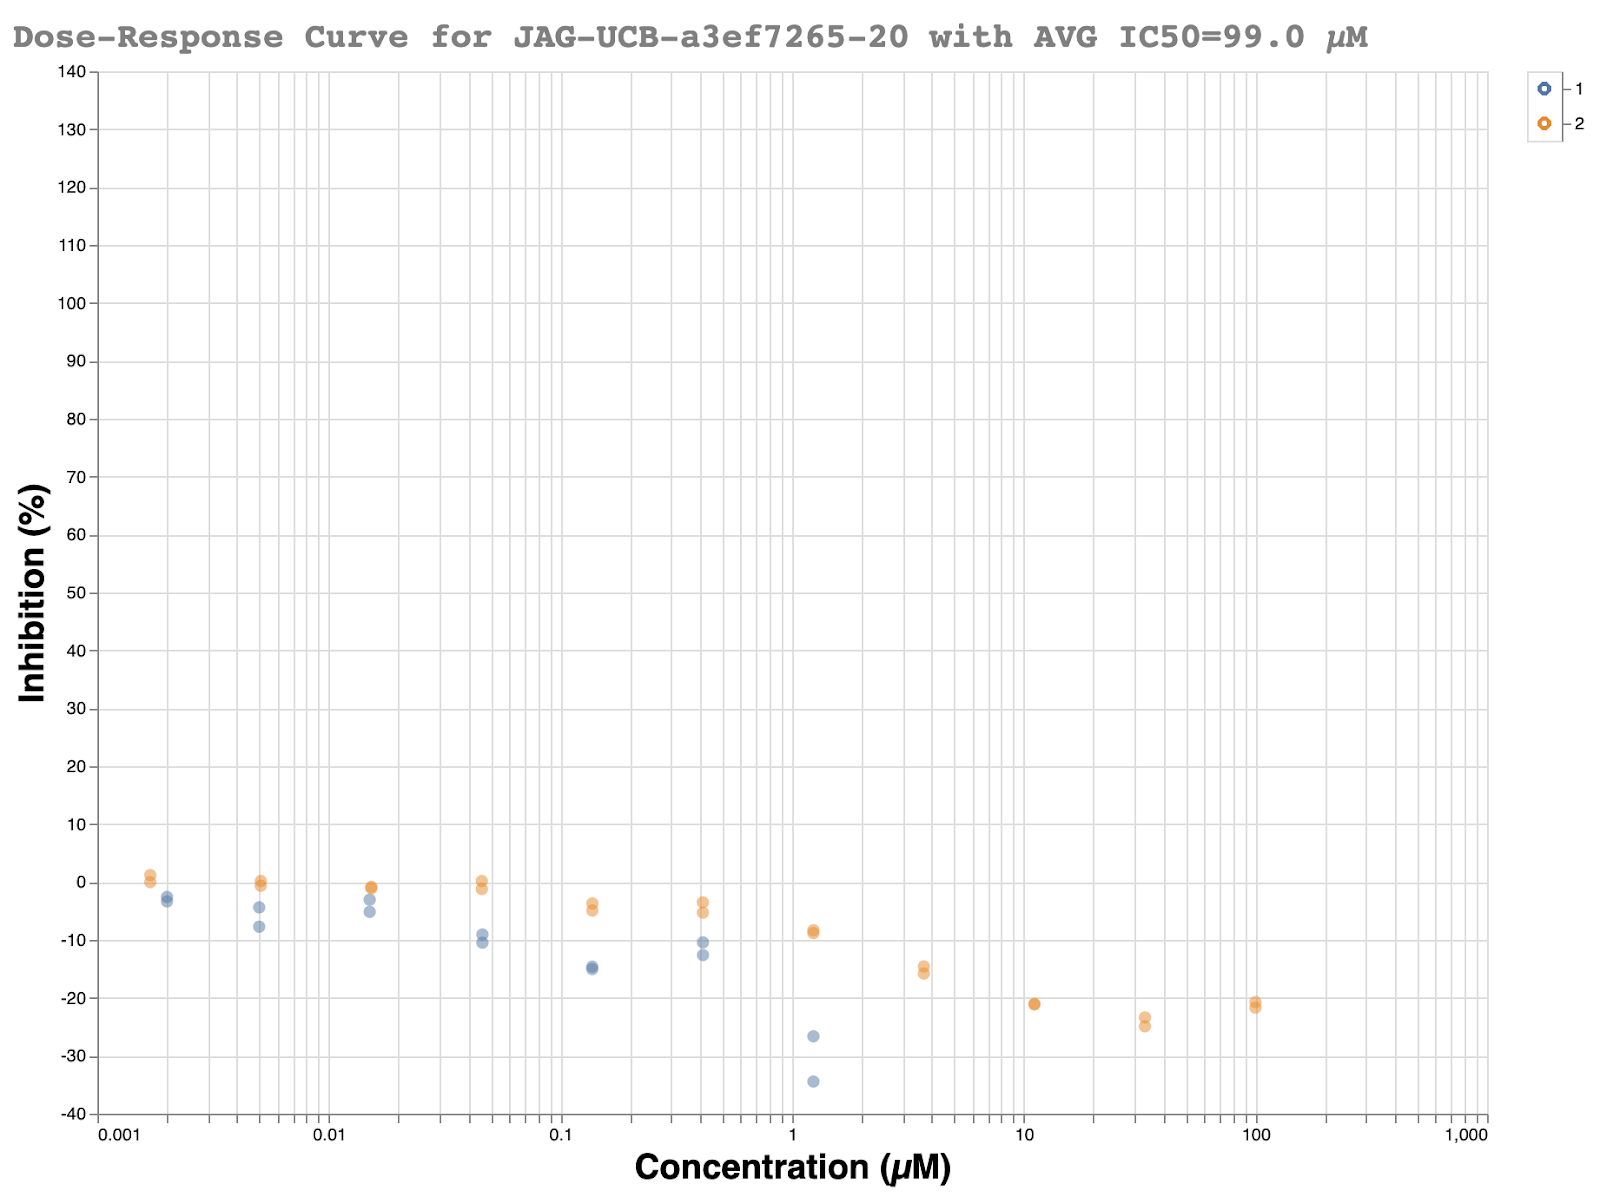
Given that a well-defined structure existed, and the compound nicely fits the pharmacophore of compounds already shown to be active, one simple explanation was an empty well in the RapidFire assay or a strange liquid handling error. However, LC-MS showed that the compound was indeed present in the well with 96% purity. A bit later, readouts from the MS protease assay also showed the sample was present while testing potency. It was decided that the true test would be to resolve the enantiomers and have both assays retest the compounds.
While all of this was occurring, the practicalities and pressures of real rather than ideal drug hunting come to bear. Either we could do a detailed study of exactly what is happening, and only move forward with analogues when all was confirmed, or decide to take a limited risk, have some close analogues made and, in parallel, get the enantiomers resolved to understand their binding.
There are a number of ways a compound could give a positive result in the fluorescence assay and negative in the RapidFire assay - we considered the following:
- Highly active impurity (there is a 4% peak visible in the LC-MS, identity unknown) for example a coupling agent, or oxidant that could interact with the enzyme cysteine and render it inactive,
- The compound could be a fluorescence quencher,
- It could be insoluble in one assay’s conditions and not the other.
Given these three hypotheses, we would expect the following results once the enantiopure molecules were resolved.
- Little to no activity in both assays for both enantiomers once impurity is purified out.
- Both enantiomers show sub-micromolar activity in the fluorescence assay and little to no activity in the rapidfire assay.
- The potent enantiomer is potent in the fluorescence assay, while the other enantiomer is inactive. Both likely show inactivity in the RapidFire assay, where the compounds are insoluble.
In an ideal world, upon chiral resolution, each assay would have shown one active enantiomer and one inactive enantiomer, as predicted by the structure. Needless to say, little in the year 2020 has been ideal. Neither the purportedly active ( R ) enantiomer JAG-UCB-119787ef-1 nor (S) enantiomer MAT-POS-968e8d9c-1 showed any activity in either assay. All of the dose-response curves were flat lines.
However, follow-up runs of the Weizmann fluorescence assay showed that the original sample of JAG-UCB-119787ef-1 was indeed still potent… if glycerol was present in the protein buffer. Importantly, glycerol had been present in the original fluorescence assay where significant activity was observed, but never in the RapidFire assays.
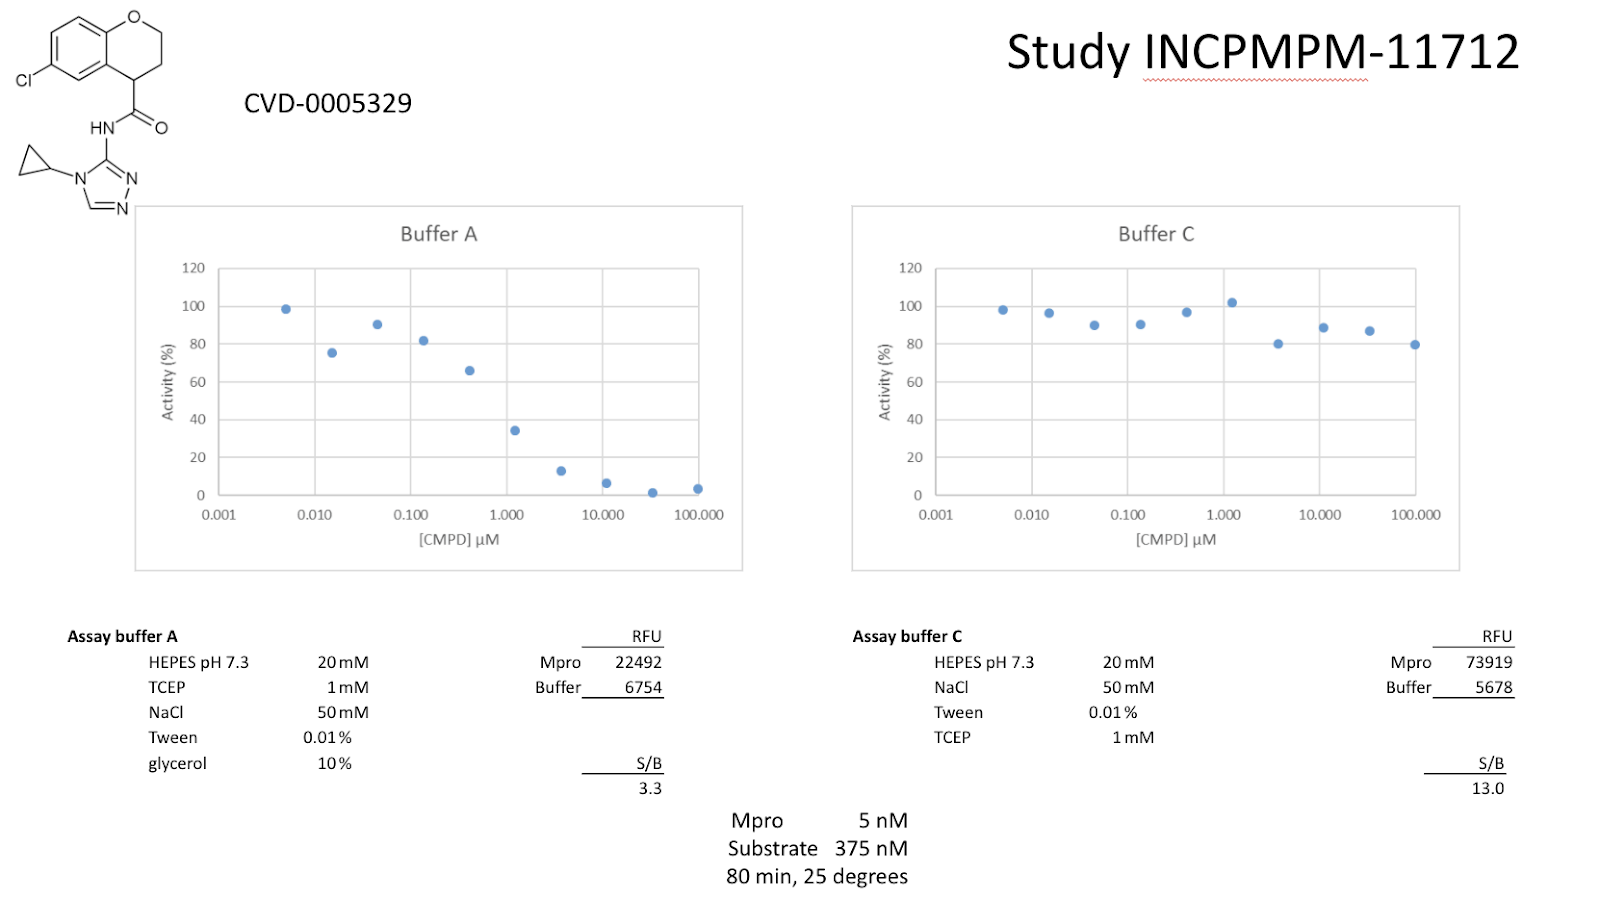
The crystal structure was checked to see if the compound was achieving a strong interaction with the protein through glycerol, but none was observed. Thus, one reaches the more normative question as to if glycerol should be present in the assays to stabilize the protein, prevent aggregation, etc… Enantiomers are also often less soluble than the racemic mixture – perhaps glycerol was aiding with solubility?
There are many questions regarding glycerol to which we do not currently have the answers. The current strategy for the fluorescence assay at Weizmann is to re-optimize the assays and run them again on all of the compounds, since they are all nicely plated.
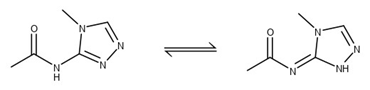
As for characterization of the compounds, we have still made and are testing some very simple analogs – only one has shown moderate activity in both assays LON-WEI-0a73fcb8-7. Furthermore, we are getting an NMR and small molecule crystal structure of the enantiopure compounds. It is worth mentioning that the alkylated triazole in JAG-UCB-a3ef7265-20 can be quite difficult to identify by simple 1H NMR, and three very similar structures will have almost identical spectra.
So where are we now, and why write this up in this form?
We’re pushing forward with other compounds that have the P1-P2 binding pockets filled, still balancing the urgency of developing SARS-CoV2 inhibitors against being pragmatic about confirming results rigorously as we go. We wanted to give a ‘real life example’ of how results have to be checked - assays are complex and at the start when you don’t have any potent compounds, the assay is being validated as the compounds are found. As Ed reiterated to me, “This is ‘real life’ complex drug hunting, not a sanitised ‘publication ready’ or ‘textbook’ view. If you’ve been here before, you recognise the issues - if not - then be aware that this is a regular part of hit work up - compounds and assays aren’t what they seem, reliable data on potent compounds has to be won by old fashioned hard work.”
So that is part of what we have been up to. I want to thank all those who helped with the investigative work on this compound @edgriffen, @BAL, @robinsonrp, @RGlen, @londonir, and many others. And sorry to Jag; our naming convention means that he got the credit when this compound looked good, but also that his name has to be included in the postmortems of compounds that were once promising. Nevertheless, his great work has led to a low single-digit micromolar compound that replicates in both assays ALP-POS-91609ae9-1 and a member of his team at UCB, Adam, has submitted a compound ADA-UCB-6c2cb422-1 that shows an initial ~700 nM IC50 in fluorescence, and strong inhibition in RapidFire (full IC50 to come). As we know from all of this, a lot of confirmatory work is still left to do!
Otherwise, I will be following up in a couple of days with a more extensive overview of the currently promising compounds. We have also made some changes to the website, allowing for better viewing of compound provenance (see the “inspired by” field), viewing of individual IC50 curves for each compound where they exist at https://postera.ai/covid/activity_data Please let us know if you have trouble accessing any of the data you need.
Otherwise, below I will post the assay protocols and hope to write up more again soon.
-Matt, with help from @edgriffen of MedChemica, and the whole rest of the Moonshot team
Assay Protocols:
Fluorescence:
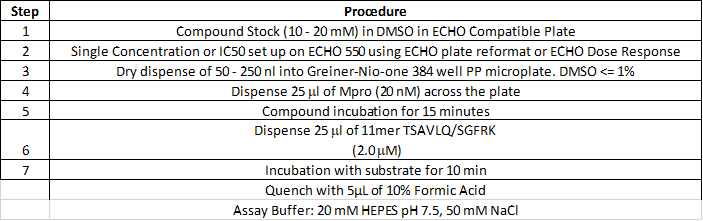
Compounds were seeded into assay-ready plates (Greiner 384 low volume 784900) using an Echo 555 acoustic dispenser, and DMSO was back-filled for a uniform concentration in assay plates (maximum 1%). Screening assays were performed in duplicate at 20 µM and 50 µM. Hits of greater than 50% inhibition at 50 µM were confirmed by dose response assays. Reagents for Mpro assay reagents were dispensed into the assay plate in 10 µl volumes for a final of 20 µl. Final reaction concentrations were 20 mM HEPES pH=7.3, 1mM TCEP, 50 mM NaCl, 0.01% Tween-20, 10% glycerol, 5 nM Mpro, 375 nM fluorogenic peptide substrate ([5-FAM]-AVLQSGFR-[Lys(Dabcyl)]-K-amide). Mpro was pre-incubated for 15 minutes at room temperature with compound before addition of substrate. Protease reaction was measured continuously in a BMG Pherastar FS with a 480/520 ex/em filter set.
RapidFire High-Throughput Mass Spectrometry:
Label free direct measurement of product is done through the following procedure:
STD NMR:
Thanks to John Vakonakis and Anastasia Kantsadi, we also have Saturation Transfer Difference (STD)-NMR results (find them now in the table at https://postera.ai/covid/activity_data)
Instruments
- Oxford Biochemistry 950 MHz NMR (Oxford Instruments magnet, Bruker AvanceIII console, 5mm TCI cryoprobe with tuning accessory, SampleJet temperature-controlled sample changer)
- Eppendorf 5810R centrifuge with deepwell plate rotor
- Eppendorf 5355 thermomixer
- Eppendorf Repeater Plus repeating pipette
- Gilson pipettes
Sample preparation procedure
Final concentrations in NMR samples
5% v/v D6-DMSO
10% v/v D2O
10 μM Mpro
90 μM ligand
Centrifuge ligand-containing 96-well plates at 3 500 rpm, 4 oC, for 5 minutes.
Dissolve the ligand adding 7.75 μl of 100% v/v D6-DMSO to each well of the plate.
Dispense 147.25 μl of PBS supplemented with D2O (ligand-only control experiments) or PBS supplemented with D2O and Mpro (STD experiments).
Seal 96-well plate with adhesive aluminium foils and shake at 500 rpm at RT for 30 min.
Centrifuge 96-well plates at 3 500 rpm, 4 oC, for 5 minutes.
Transfer (in multiple, small steps) at least 140 μl of each ligand-containing solution to racked, 3 mm NMR tubes, using gel-loading tips.
Seal NMR tubes with pom-balls, record position and barcode per sample
NMR procedure
Pre-set temperature of NMR instrument and sample changer (SC) to 10 oC. Equilibrate for at least 30 min.
Insert NMR tube racks to SC and record the rack position. Set the SC to 3 mm shuttle mode.
Using TopSpin (currently, version 3.6.1, topspin commands or pulse sequences in parenthesis):
Insert first sample in magnet with SC (sx). Let equilibrate for at least 4 min.
Tune/Match ATM probe manually (atmm).
Read previous shim-set, optimised for 3 mm tubes (rsh).
Lock on D2O frequency using 90% H2O / 10% D2O preset (lock).
Perform 3D gradient shim followed by temperature-optimised gradient shim (topshim 3d; tso).
Optimise lock phase (autophase).
Calibrate 90o 1H pulse length, record H2O frequency (zg pulse sequence).
Enter new 1H pulse length and H2O frequency in otherwise optimised STD-NMR parameter set for Mpro (stddiffesgp.3 pulse sequence).
Save experiment parameters (wpar) and sample shims (wsh).
Using IconNMR Automation (currently, version 5.0.9 build 47):
Setup automation experiment using saved experiment parameters and sample shims.
For each new sample allow 4 min of temperature equilibration.
For each new sample perform automatic tuning/matching (atma), locking using 90% H2O / 10% D2O preset (lock), gradient shimming (topshim), receiver gain adjustment (rga).
Each new sample takes ~1 h total time, including overheads.
Data analysis
Using TopSpin (currently, version 3.6.1, topspin commands in parenthesis):
Deconvolute the STD and reference spectra (stdsplit) into 2 directories. Reference frequency is #2.
In the reference spectrum, apply window function, FT and phase the spectra (efp; apk). Record the phase correction values PHC0 and PHC1.
Copy PHC0 and PHC1 values to STD spectrum, apply window function, FT and phase (efp).
Manually compare the reference spectrum to presumed ligand chemistry. Note impurities and/or concerns.
Integrate the areas of DMSO and ligand peaks in the reference spectrum. Derive ratio of integrated areas between DMSO and single 1H of ligand as metric of relative ligand concentration.
Integrate the areas of ligand peaks in STD spectrum. Derive the ratio (multiplied by 103) of ligand peak areas between STD and reference spectrum as metric of ligand binding to Mpro.